|

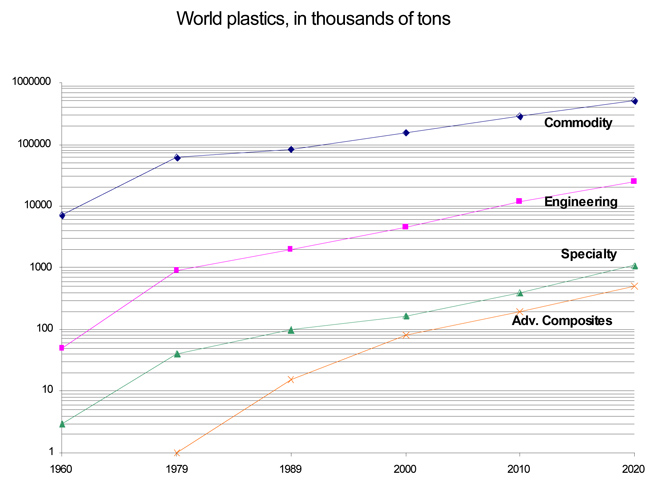
World plastics consumption long term, 1960-2020
The semi log graph shows the rates of past and future plastics growth, over a sixty year time span, from 1960 to 2020. It takes that long a time for any of the four major plastics categories, to slightly change their order of magnitude that is to shift log cycles on the graph. Moreover, not any of the most dynamic of the engineering plastics will be achieving commodity plastics status by 2020, except maybe for polycarbonate and some alloys.
| Commodity |
7000 |
60000 |
155000 |
287000 |
510000 |
8% |
6.15% |
| Engineering |
50 |
900 |
4500 |
12000 |
24500 |
12% |
8.8% |
| Specialty |
3 |
40 |
170 |
400 |
1100 |
11% |
9.8% |
| Advanced Composites |
0 |
1 |
80 |
200 |
500 |
23% |
9.6% |
The average annual rate of growth of 8.1% that brought all solid polymers from:
7 million tons in the world in 1960 to 196 million tons in 2005 and to continue reaching over 365 million tons in 2015, 540 million tons in 2020, using a more conservative annual rate of 6.5 %.
Total world production/consumption of plastics, since the beginning, at the turn of the twentieth century, kept an average annual rate of growth of 15 %, or doubling every five years, until 1975-1979, when this trend was broken at the first oil shock. This high growth rate was never achieved again, the average annual growth rate of plastics was 15% from 1960 to 1974, and 8% thereafter, from 1974 to 2000, and 2005.
Plastics demand growth in the new vast and fast developing markets is another story, averaging more than 10-15 % a year, just like it was in the heyday of the plastics built-up in Europe, USA and Japan, in the 1960-1975 era.
back to the top of the page |
|